
As mentioned earlier this week, individual stock performance across all MSCI regions seems to be struggling a bit--even as the indices themselves push to new highs:

The 200 day advance/decline ratio for MSCI Europe remains at low levels, indicating that ~75% of stocks in this group were up over the last 200 days while the other 25% were down:


Breadth of participation has been generally strong for quite some time now, with the Energy, Consumer Staples, and Health Care sectors lagging a bit:


New 20-day highs are easier to come by than new 200-day highs, led by constituents in the Energy and Financials sectors:

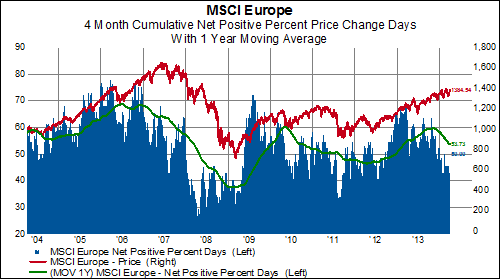
Net positive price change days have diminished, especially since the beginning of the year:
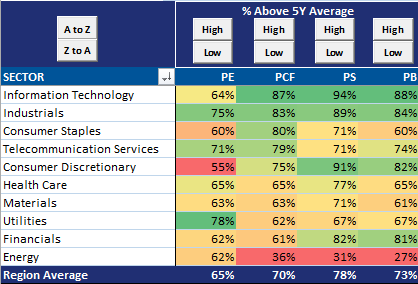
Turning to valuations, 70% of stocks in MSCI Europe are above their five-year average P/CF. In all but one sector (Energy), at least 60%--and up to 87%--of constituents exceed that measure:

The bottom line: MSCI Europe looks pretty extended on a technical basis-- with a few cracks beginning to surface?